DOTMETRIX SYSTEM v1.0.0
Copyright (C) Andreas Panagiotakopoulos. All rights reserved.
────────────────────────────────────────
Initializing display adapter.......... OK
Mounting creative filesystem........... OK
C:\DOTMETRIX> _

Andreas Panagiotakopoulos — analyst and maker operating at the intersection of data and visual systems.

Over a decade of experience reading patterns in complex environments. Now translating that into code, visuals, and physical output.

Currently working as AI Quality Analyst at Teleperformance. Running a pen plotter. Learning what machines can see that humans miss.

TOOLSIllustrator, TouchDesigner
OUTPUTPlotter, Screenprint, Digital
DATASQL, Excel, R, Tableau
DOMAINBehavioral Analytics, AI QA
CERTGoogle Data Analytics '25
STATUS● OPEN TO WORK

OUTPUT.DIR

BROWSE
Tyche
TYCHE
TOUCHDESIGNER / 2026
Cupid
CUPID
TOUCHDESIGNER / 2026
Analogo
ANALOGO
TOUCHDESIGNER / 2026
Aegiali
AEGIALI
PLOTTER / 2025
Aegiali
AEGIALI
PLOTTER / 2025
Tyche
TYCHE
TOUCHDESIGNER / 2026
Cupid
CUPID
TOUCHDESIGNER / 2026
Analogo
ANALOGO
TOUCHDESIGNER / 2026
Aegiali
AEGIALI
PLOTTER / 2025
Aegiali
AEGIALI
PLOTTER / 2025

DATA×OUTPUT

INDEX
ABC × RGB

Children's drawings analysed for colour. Tracking how colour choice evolves across grades.

DATACOLOUREDUCATION
REGIONAL SIGNAL TRACE

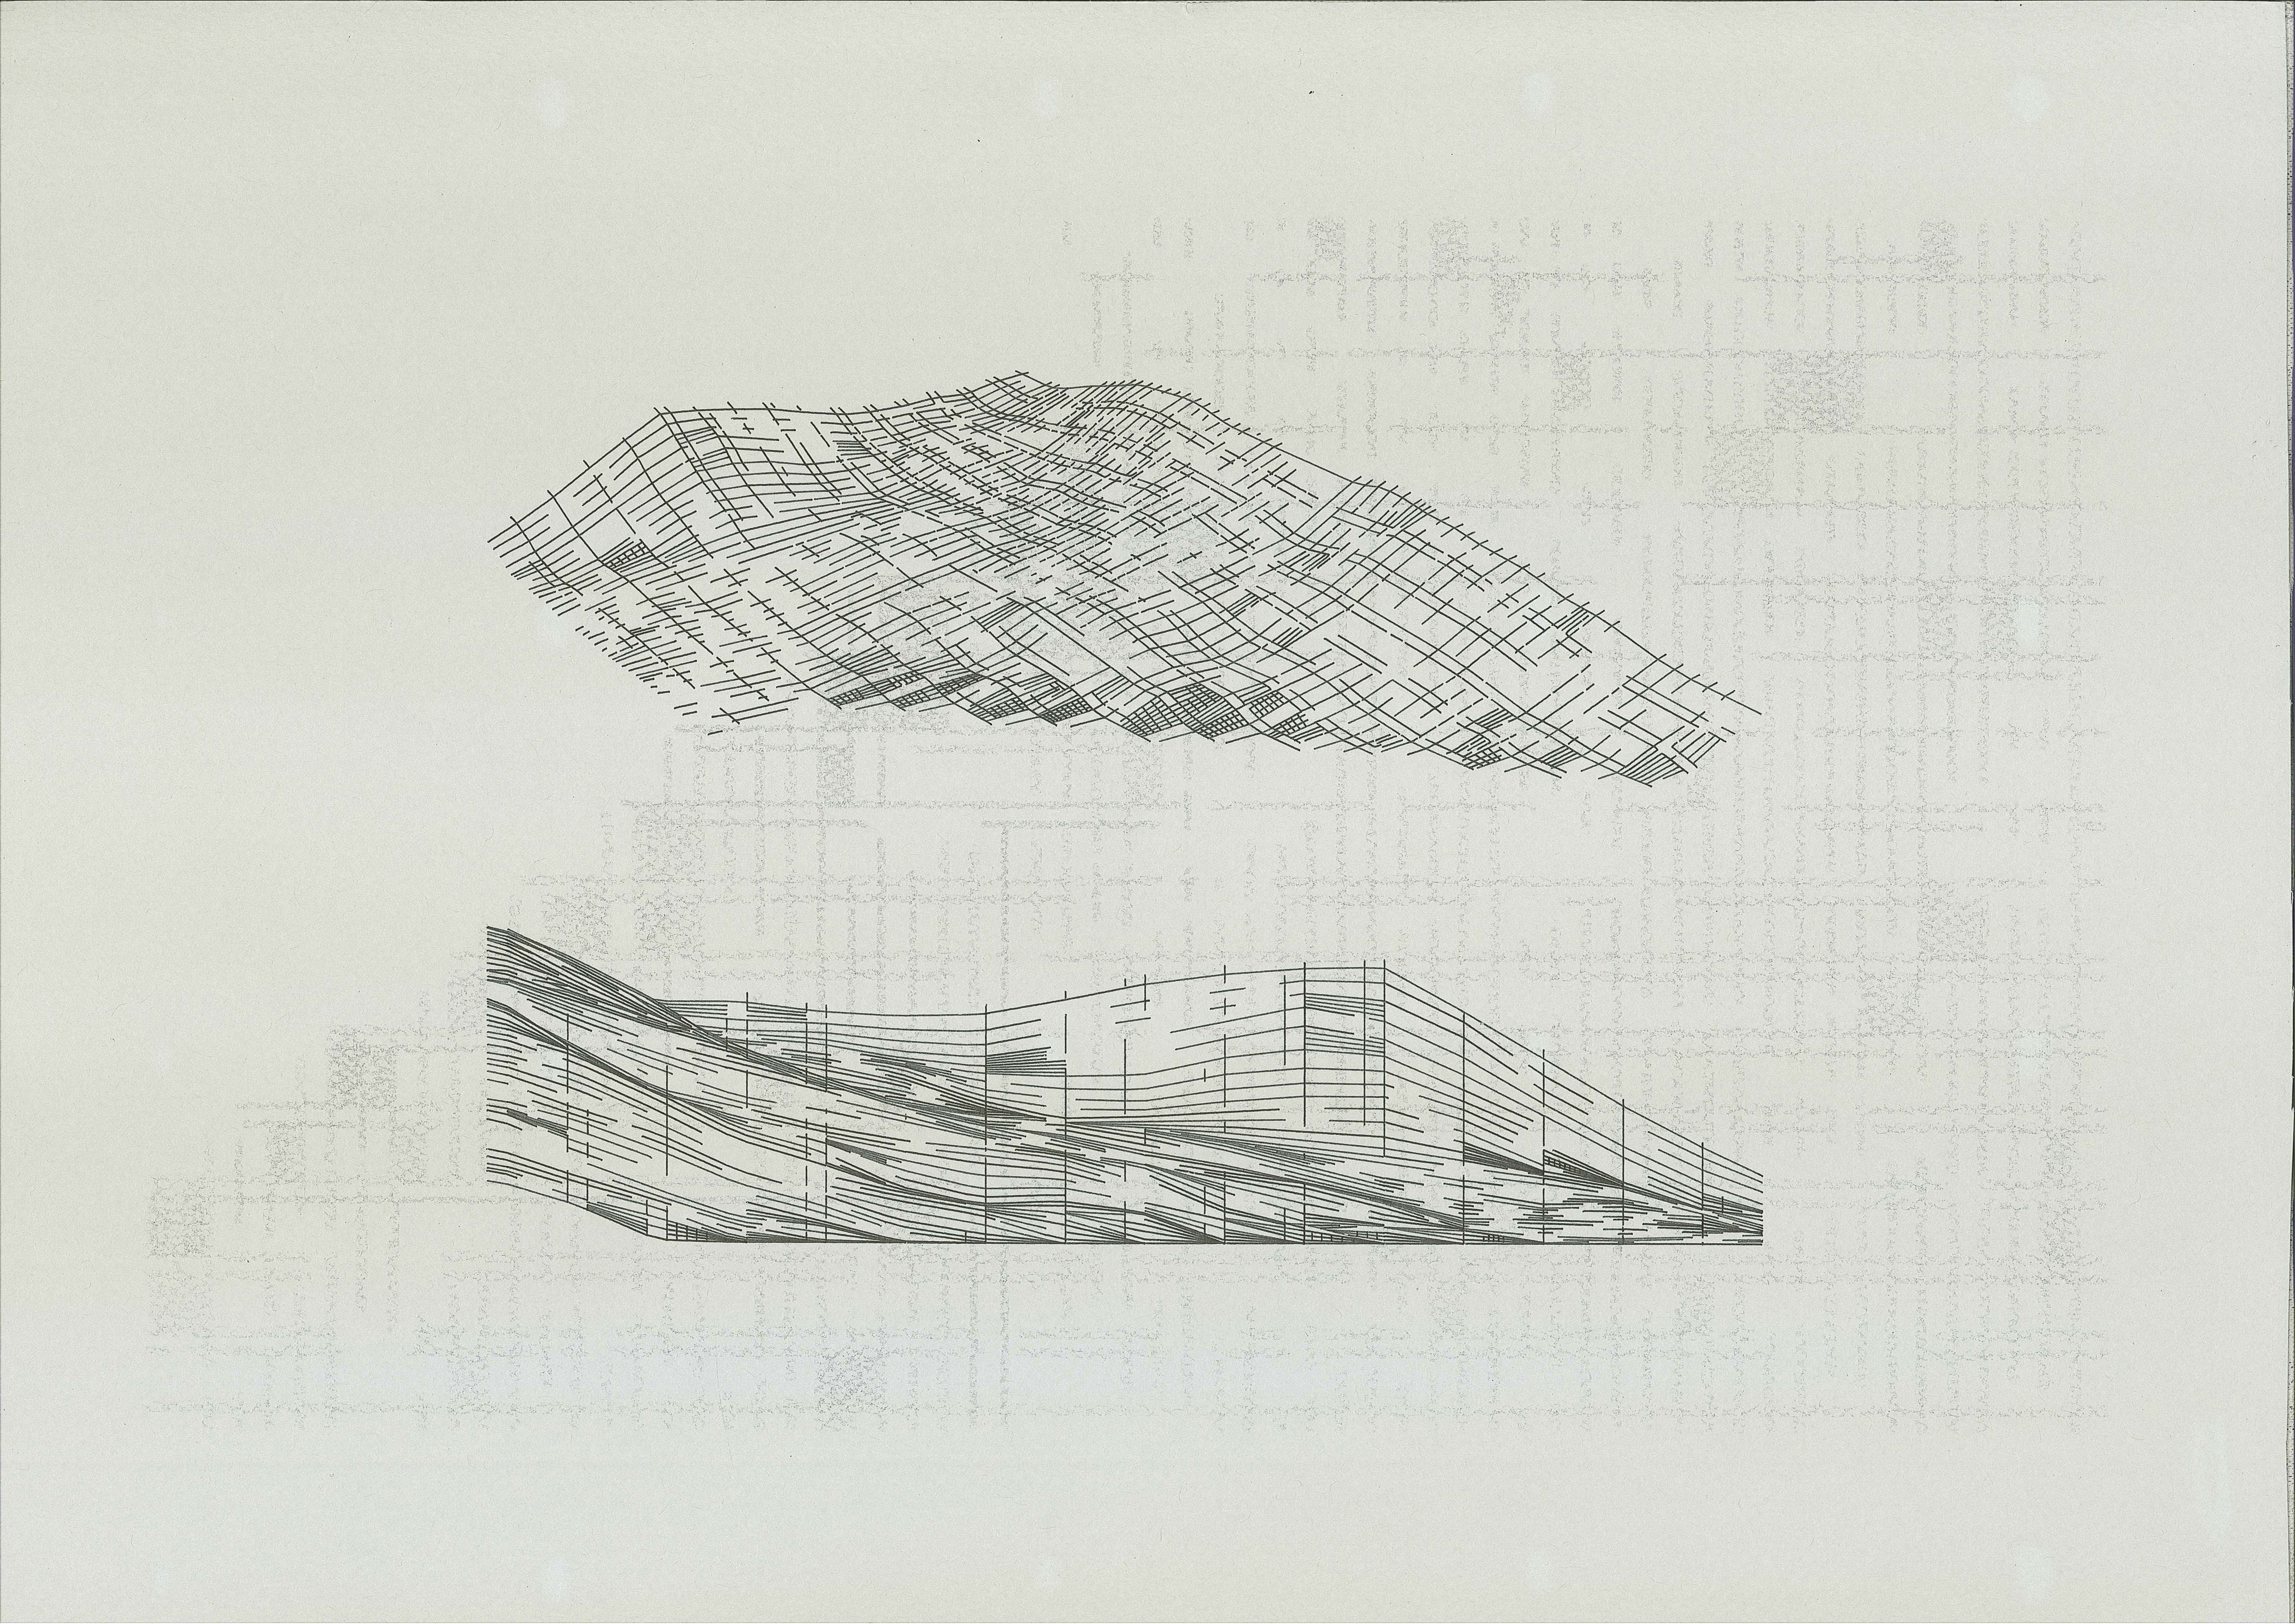
Greek regional unemployment rates 2000–2023 (Eurostat) overlaid with the brain drain emigration index. The front plane traces emigration — the human cost behind the numbers.

DATA3DTIME-SERIESEUROSTAT

PROJECT

DETAIL
[IMG]
NO MEDIA

ABC × RGB

COLOUR STUDY
// OVERALL PALETTE
// COLOUR DISTRIBUTION
// DOMINANT COLOUR × AGE — DOT MATRIX
// ALL DRAWINGS — DOMINANT COLOUR
Dataset updates as drawings are added.

REGIONAL SIGNAL TRACE

3D VIZ
[ CLICK TO EXPAND ]
// ABOUT THIS VIZ

Greek regional unemployment rates (2000–2023) from Eurostat, with the brain drain emigration index on the front plane. The crisis years of 2010–2015 are visible as a dramatic spike across all regions simultaneously. Eastern Macedonia and Thessaly record the highest peaks. The front line — brain drain — tells the human story: as unemployment rose, people left.

Built with vanilla Canvas 2D using a custom 3D projection engine. No libraries. Data: Eurostat lfst_r_lfu3rt (unemployment %) + ENA Institute emigration index, 2000–2023.

CANVAS 2D3D PROJECTIONTIME-SERIESEUROSTATINTERACTIVE

ANALYSIS.DB

RESTRICTED

// LOADING CASE FILES...

Data analysis case studies — coming soon.
Check back when the database is populated.

CONTACT.INI

OPEN
LOCATIONPyrgos, Western Greece — Remote OK
STATUS● AVAILABLE FOR WORK

Open to remote roles in data analytics, AI/ML quality, creative technology, or anything that sits between data and visual systems.

Also open to collaborations, commissions, and conversations about plotter work, generative systems, or building strange things with data.